




Soil Insights
Seasonal Primers
5 Inches of Rain Later: Should You Manage, Patch, or Replant?
Heavy rain can quietly turn emergence problems into season-long yield losses. Learn how to assess stand counts, identify crusting damage, evaluate crop uniformity, and decide whether to manage, patch, or replant affected fields.
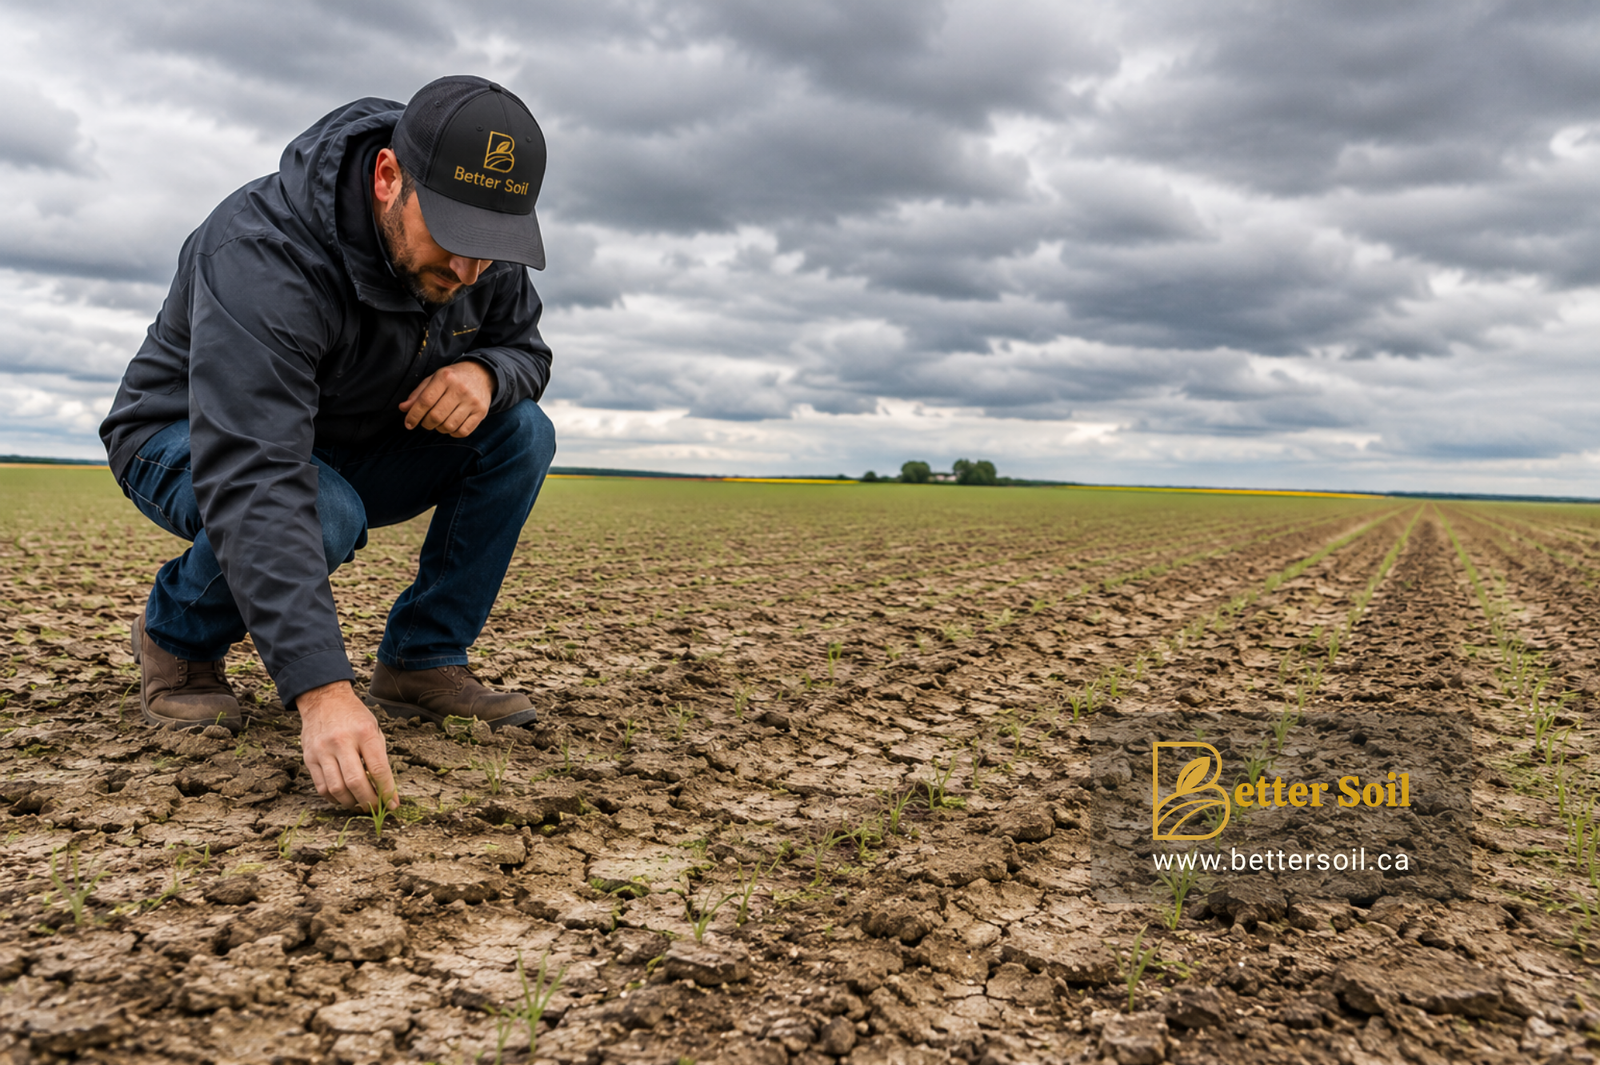
Table of Contents
 Evaluating Crop Emergence After Heavy Rain
Evaluating Crop Emergence After Heavy Rain
Two fields can receive the exact same 5 inches of rain. One still hits its yield target. The other never recovers. The difference isn't usually fertilizer. It's what happened during emergence. Over the next 10 days, you'll find out whether your crop came through the storm intact — or whether yield losses have already started. Cereals, canola, pulses, corn — each with its own assessment method, its own target stand for irrigated and dryland southern Alberta, and its own threshold for *should I do something about this?
Why the post-rain window matters
Two things are happening to your emerging crop after a heavy rain, and both push you toward the same diagnosis.
Soil crusting
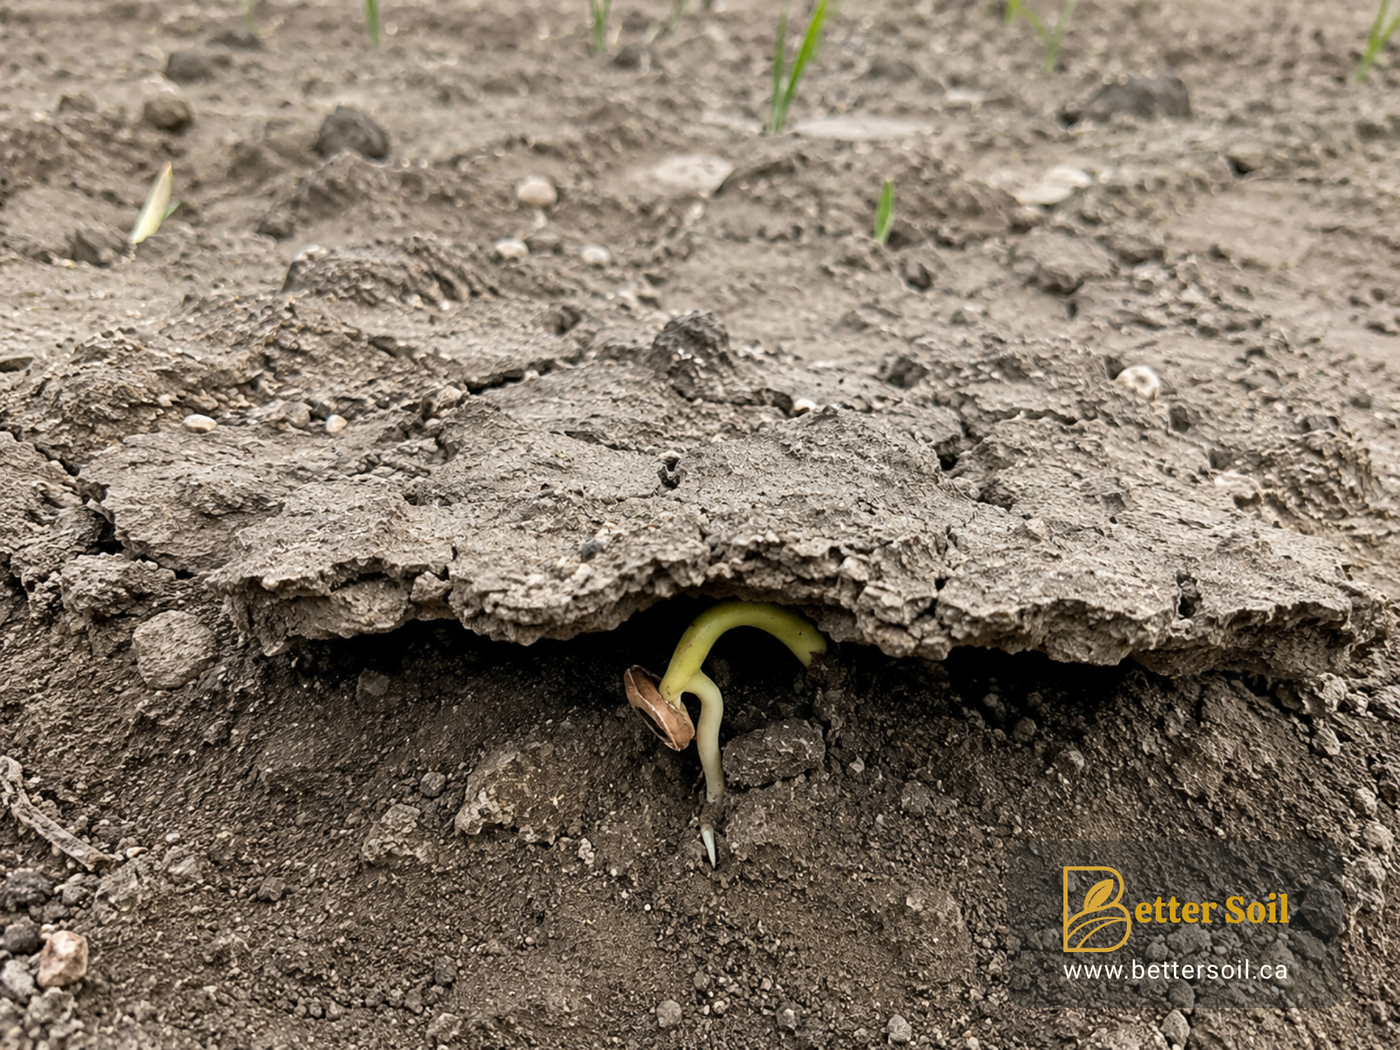
When rain hits bare or thinly covered soil, the impact energy breaks down surface aggregates, finely packing into a crust as the surface dries; it can look like the soil experienced hail due to all the small impact marks from the rain.
On the calcareous, lower-organic-matter, often sodium-influenced soils that dominate the irrigated corner of southern Alberta, that crust can be brutal — restricting coleoptile penetration in cereals, snapping the hypocotyl in dry beans (more on that below), or trapping canola cotyledons underneath. The crop emerges unevenly, or in patches, or not at all in the worst spots.
Uneven moisture at seed depth
Heavy rain followed by surface drying creates exactly the moisture profile that causes the most uneven emergence: dry at the top, soaked in the middle, with seeds at slightly different depths hitting completely different conditions. Some race ahead, some lag, some sit and wait for the surface to soften again.
The combined effect plays out in roughly the same calendar window across crops. Visible symptoms typically show up 4 to 10 days after the event, and the actionable assessment window for most crops closes inside two to three weeks of emergence. After that, the late-emerger penalty is already banked and the management options narrow fast, so walk the fields now.
There's one more issue worth knowing before we get crop specific.
Uniform emergence matters. Research has shown that a corn plant that's one leaf stage behind its neighbors may give up a few percent of its yield potential, while plants that lag two or more stages behind often become uncompetitive and can suffer major yield losses." — it becomes, functionally, a weed.
This principle applies across crops with surprisingly little variation. Whether you're walking cereals, canola, pulses, the question to ask is: how many of these plants are noticeably behind, and how far behind are they?
How to actually count
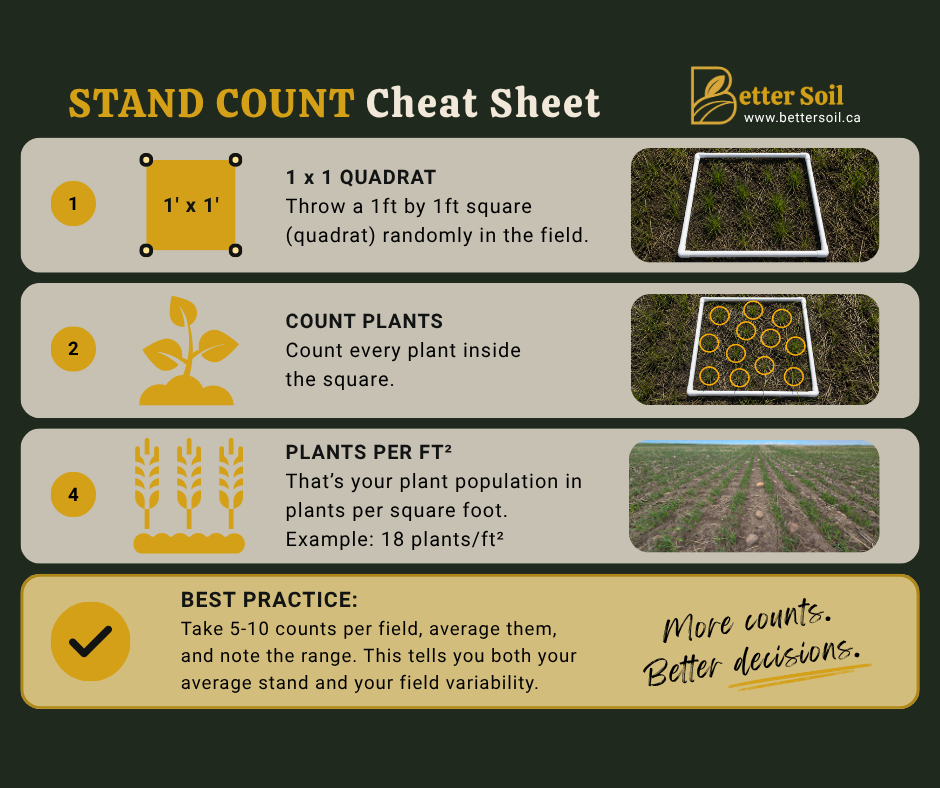
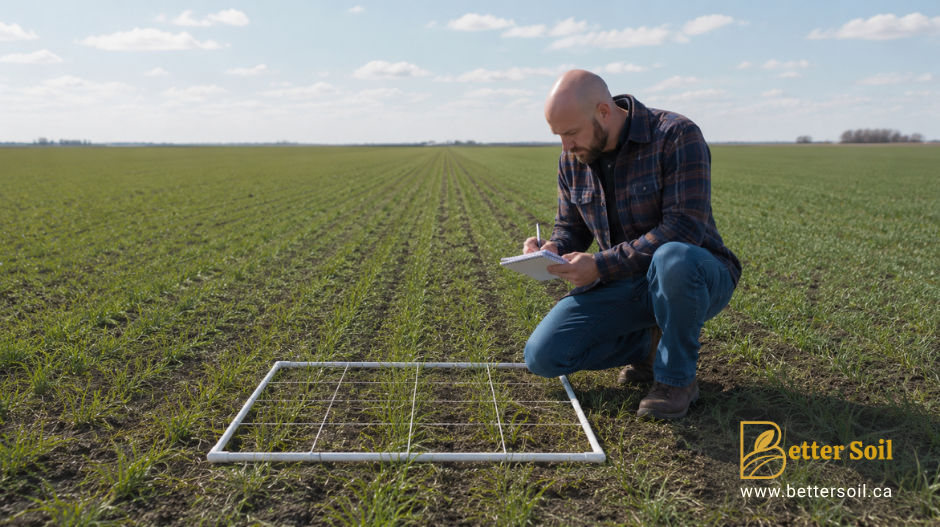
For most crops, the practical tool is a 1 ft × 1 ft square — light tubing, PVC, even a length of rope tied off to a one-foot perimeter works fine. Toss it randomly into the field, count every plant inside the square, and that count is directly your stand in plants per square foot — no math required. Seven canola plants in your 1×1 and you're sitting right in the middle of the target range.
A square beats trying to measure along a single row because it samples across the rows — a 1×1 dropped on 7-inch-spaced cereals still catches at least one pass of the drill and removes the across-row variability you miss by walking a single row.
One small refinement worth building into the habit: place the square diagonally, so a row runs from one corner to the opposite corner of the square. That way every toss catches multiple rows at an angle, and you're not accidentally landing the whole square inside a row gap or biased toward one drill pass. It's a small change that meaningfully improves the honesty of your data.
A few growers prefer a hoop instead of a square (same idea, easier to toss without snagging on residue). Some use a 0.25 m² hoop (about 2.7 ft²) for canola because that's what the Canola Council's Canola Counts protocol uses — in that case divide the plant count by 2.7 to get plants per square foot, or just work in metric (plants per m²) and use the Canola Council thresholds directly.
Pick whatever shape and size works for your eyes and stick with it across a field so the numbers are comparable. The one discipline that matters more than anyone wants to admit: toss it blind.
Walk into the field, look up at the sky, and throw it without aiming — or close your eyes and toss it behind you. The minute you start picking spots that look representative, you're sampling the better part of the field. A random toss catches the variation honestly, including the bad patches you'd rather not see.
Plan on 5 to 10 tosses per field — AHDB (UK) sets the standard at 10, and that's the right target if you can do it; 5 is the realistic minimum that still gives you useful data. More if the field is variable or has obvious zones — knolls, low spots, headlands, the heavy-clay corner that always struggles. Average the counts while also noting the range.
If one toss is 4 plants/ft² and another is 12, that variability itself is information about how uniform your stand really is — and a wide spread is often more actionable than the average number alone.
One bonus to building the habit: the same square you use for stand counts also works for measuring crop dry matter and nitrogen uptake later in the season. Toss it, cut everything inside at ground level, dry the sample, weigh it, and you've got crop biomass per area — with a tissue sample available for N analysis if you want to take the data further.
One tool, multiple uses through the season.
Corn is the exception — it gets counted by the 1/1000th acre method because of its wider row spacing. For 30-inch rows, that's exactly 17 feet 5 inches of single-row count, multiplied by 1,000 to get plants per acre. Brian and Darren over at AgPhD just put out a good piece showing exactly this — if you haven't watched it, go find their Corn Stand Counts: What They Mean and What They Tell You episode, then come back here for the Southern Alberta side of the story.
Cereals — wheat, barley, durum
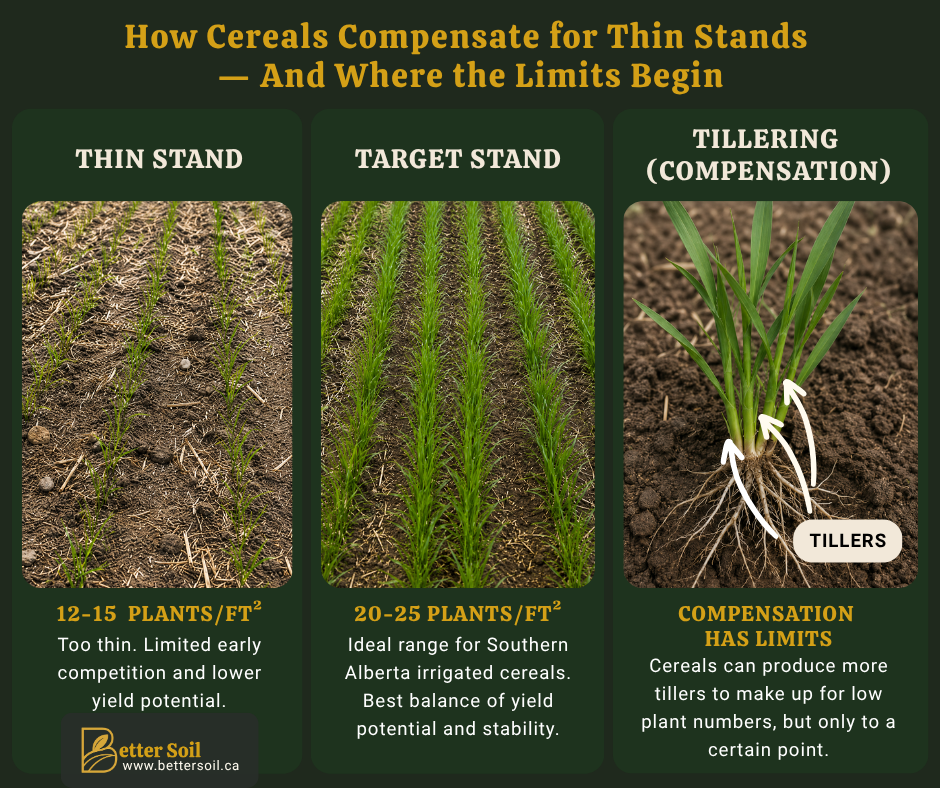
Spring cereals are the most forgiving of an uneven start, because they can tiller. A thin stand under good conditions will partially compensate by throwing more tillers per plant, and the head count at harvest (which is what actually drives yield) recovers some of what the plant count lost. But "partially" is the key word — tillering compensation has real limits, and it costs you uniformity at maturity, which costs you at the swather.
Target stand for southern Alberta irrigated cereals, drawn from Ross McKenzie's long-running research at the old Alberta Agriculture Lethbridge station and the more recent Alberta Grains material:
- Hard Red Spring Wheat: 19-28 plants per square foot (some current recommendations push 30+)
- Durum: similar to HRSW, 22-30 plants per square foot
- Malt barley: 17-24 plants per square foot (don't push higher — lodging and quality risk)
- Feed barley: 19-33 plants per square foot
What to look for after a heavy rain:
- patchy emergence,
- plants visibly behind in a strip or low spot,
- "sideways" coleoptiles that hit a crust and curled instead of pushing through, and
- the classic leafing out underground where the first leaves emerge before the coleoptile breaks the surface.
When to act:
If an average stand is above the low end of the target range with lagging plants no more than 1 leaf stage behind, leave it alone — tillering will fill in.
If this average drops below about 12-15 plants per square foot across meaningful areas of the field, or if a significant share of plants are 2+ leaves behind, you've got a thin/uneven stand to manage.
Replanting cereals in-season rarely pencils once you're past the early-May window, so the more likely tools are tighter weed control (a thin stand competes poorly), a foliar nutrition program to push the tillers you've got, and noting the field for fungicide timing decisions later.
Canola
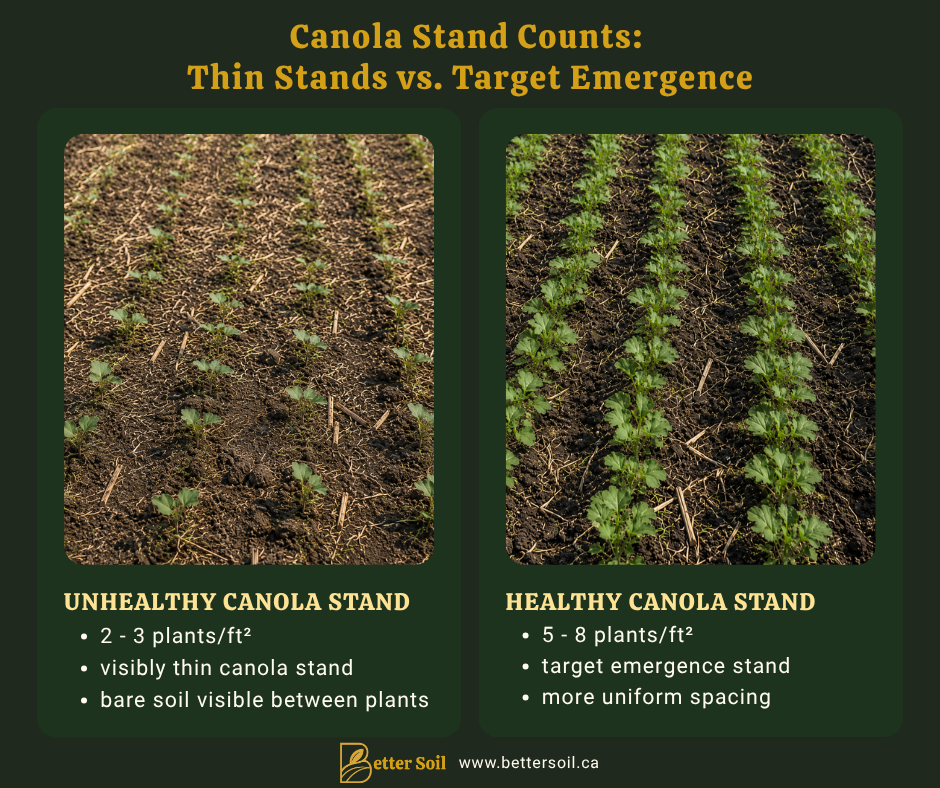
Canola is in some ways the most forgiving and in some ways the most fragile, depending on what you measure. It's forgiving on the yield side because it compensates ferociously through branching — Canola Council research shows that stands of 5 to 6 plants per square foot yield about five bushels per acre more than 2 to 3 plant stands, but the dropoff steepens fast below 5.
It's fragile on the establishment side because the seed is small, has minimal reserve energy, and absolutely needs to be shallow — half an inch to one inch deep — which means a crusted surface is a serious problem.
Current Canola Council target: 5-8 plants per square foot at emergence, with 3-4 being the absolute minimum to maintain yield potential. (Note: the older 7-10 recommendation has been formally revised down to 5-8, balancing seed cost against yield risk. Below 5, you're rolling the dice.)
What to look for:
- patchy stands, especially on the high knolls where the crust set up hardest;
- cotyledons trapped under a crust;
- flea beetle pressure concentrated in thin areas (a thin canola stand is a flea beetle magnet, and we'll cover that more in the insect post coming up).
When to act:
If you're above 4-5 plants per square foot averaged across the field, the crop will compensate and you're better off managing the stand you have aggressively. Below 3 plants per square foot in meaningful areas, reseeding starts to enter the conversation, but it's an unforgiving call this late in the calendar — every day past early-June pushes the new seeding into a tight maturity window.
The Canola Council's Canola Counts tool at canolacalculator.ca is a useful frame for thinking through the decision. The other thing worth knowing: insect thresholds and fungicide spray recommendations for canola were originally built around uniform stands of 7-10 plants per square foot. If you're sitting at 4-5, your pest management decisions may need adjusting from the standard recommendations — a thin stand needs more protection, not less.
Pulses — peas, lentils, faba beans, dry beans
Pulses are where this post matters most for the Southern Alberta corridor, because we sit in the largest northern commercial bean growing area in North America (per Alberta Pulse Growers) and post-rain crusting hits these crops hard and crop-specifically.
Target stands, from Saskatchewan Pulse Growers' tables (Alberta uses the same numbers):
- Field peas: 7-9 plants per square foot
- Lentils: 11-13 plants per square foot
- Faba beans: 4 plants per square foot baseline; bump to 6 under dry conditions or late seeding
Dry beans are measured by total population per acre because row spacing varies so much:
- Pinto: 80-90,000/ac (9-12" rows), 75-85,000/ac (22"), 65-75,000/ac (30")
- Great Northern: 65-70,000/ac (22-30" rows)
- Navy/black: 140-150,000/ac (9-12" rows), 100-110,000/ac (30")
The big crop-specific watch-out for dry beans:
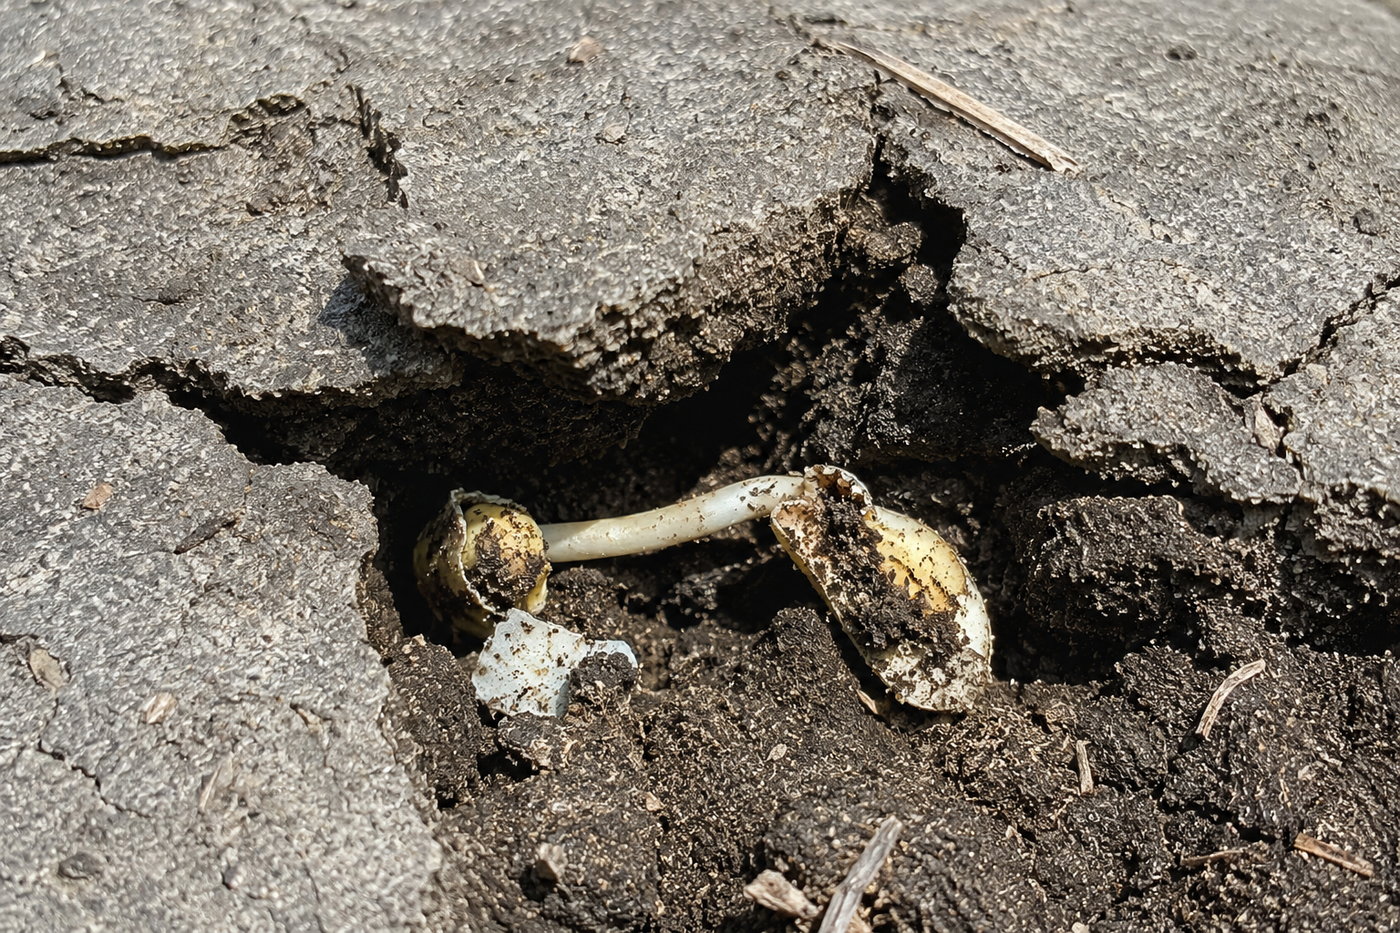
They're epigeal — the cotyledons get pulled up through the soil during emergence. That means a soil crust can literally snap the hypocotyl and decapitate the seedling, leaving you with a seed that germinated, a stem that grew, and no plant to show for it.
This is much worse on dry beans than on peas or lentils, which are hypogeal (cotyledons stay below ground). If you grew beans this spring and got hit with 5+ inches of rain followed by a hard drying surface, walking those fields is non-optional. Look for missing plants in straight-line patterns following the row, dig down where they should be, and look for snapped hypocotyls or stems trapped under a crust.
When to act on beans:
Light rotary hoeing before emergence can break a setting crust if you catch it in time — this is one of the few places a tillage tool genuinely earns its keep in-season. After emergence the call is harder; if stand losses are concentrated in patches you might patch-seed if it's still early enough in the calendar.
For pinto and Great Northern beans on 22-30" rows in southern Alberta, an average of below 50-60,000 plants per acre across meaningful areas is the point where reseeding economics start to make sense — but check with your processor or seed rep on the calendar cutoff for the maturity rating you're growing.
For peas and lentils: crusting is less catastrophic (hypogeal emergence), but uneven emergence still costs. The same general principle applies — above the low end of the target range, manage what you have; well below, consider patching the worst areas.
Corn
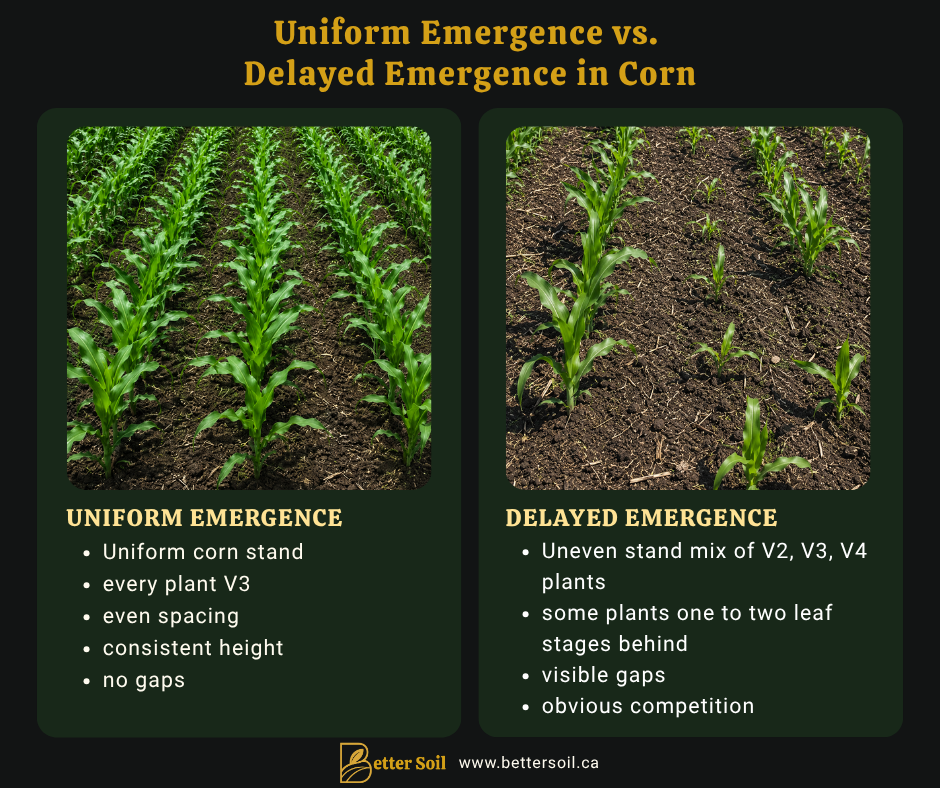
Stand count is most actionable in corn because the plants don't compensate the way cereals and canola do — corn is essentially a fixed-per-plant yield crop, so the population you set is more or less the population you finish with, and gaps and lag plants both cost real yield.
Targets for southern Alberta:
Silage corn (the bulk of Taber-area acres):
- 32,000-36,000 plants/ac final stand. Silage is more forgiving of low stands than grain — a 28,000-stand silage field still pencils, especially if the plants that did emerge are uniform.
Grain corn under pivot:
- 30,000-34,000 plants/ac final stand. Less forgiving — every gap is a missing ear.
The assessment method, in case you missed it above:
17 feet 5 inches of single-row count on 30-inch rows × 1,000 = plants per acre. Do it in 4-6 spots. So 30 plants in your 17'5" length = 30,000/ac. The "potential 300 bu" rule of thumb the AgPhD episode mentioned works out to roughly 100 bu per 10,000 plants under ideal conditions — that's an irrigated South Dakota number; for Taber irrigated grain corn at 30K population, a more realistic potential ceiling is in the 240-280 bu/ac range on top hybrids in a good heat-unit year.
The threshold for "this plant is now a weed":
Bob Nielsen's Purdue research is unambiguous on this. A plant that's 1 leaf stage behind its neighbours is mostly recoverable noise — small yield drag if widespread, near-zero if isolated.
A plant that's 2 leaf stages behind the surrounding crop will often fail to set a full ear or will be totally barren — it's competing for water, light, and nutrients without contributing yield. The Purdue replant decision tool (AY-264-W) applies a 10% yield penalty when 50% or more of plants are 2+ leaf stages behind, which is the formal version of this principle.
When to act on corn: Stand below 26,000 plants/ac with meaningful gap clusters → replant calculation; the Purdue worksheet is the standard. Stand of 28-32,000 with isolated lag plants is fine, leave it. Stand of 30,000+ with widespread 1-leaf-stage variability is also fine — count the full-yield contributors and base the decision on that number.
The Mistake Most Growers Make After Heavy Rain
The biggest mistake isn't failing to reseed. It's making a reseeding decision from the road. A field can look terrible from the pickup and still have a perfectly acceptable stand once you start counting plants. I've seen growers panic over emergence only to discover the population was fine. I've also seen beautiful-looking fields hide major stand variability underneath. Count first. Decide second.
The decision framework — manage, patch, or replant
Across all four crops, the post-rain emergence assessment usually ends in one of three management calls.
- Manage what you have is the most common and usually the right answer. If your stand is at or above the low end of the target range and the lag plants aren't catastrophically behind, the better play is to push the established crop hard — tight weed control (especially in canola and beans, where competition with weeds is brutal in a thin stand), a tissue or sap test in the next 2-3 weeks to catch the post-rain nutrient gaps we talked about last post, and a foliar program built around what that test flags. This is the standard southern Alberta playbook and it usually pencils better than the alternatives.
- Patch the worst areas is occasionally the right call — typically on dry beans where crust has wiped out specific zones, or on canola where flea beetles have shaved a stripe down to nothing. Patch-seeding works best when the patches are large enough to manage as separate units and small enough that you don't end up with two different maturities running through the combine.
- Full replant is the call you want to avoid making but sometimes the math is unambiguous. The Purdue replant worksheet is the standard tool for corn; for canola and pulses, work the numbers with your seed rep and your processor (if applicable) — both can talk you through the economics with current pricing and maturity-window realities for your area.
The general principle: if you're above 50% of target stand and the calendar is past the first week of June, you're almost always better off managing the stand you have.
What this means for the next 10 days
If you got hammered by the rain we talked about last week, this is your window.
- Walk every field, carry a metre stick, a quadrat and/or a tape measure.
- Count in 4-6 representative spots per field, including the spots that looked off from the truck.
- Make notes on what you find — population, uniformity, lag plants, crusted areas, missing-plant patterns.
- Pair the stand assessment with the tissue or sap test we covered in the last post, ideally in the same trip.
That data set — here's my stand, here's my early-season nutrient picture, here's what the canopy actually looks like — is what drives every fertility, fungicide, and harvest decision you make for the rest of the year.
The growers who do this every year, on every field, are the ones who quietly pull a few extra bushels out of average years and minimize the damage in bad ones.
And for those who don't have the time, well you can give me a call as I'll be happy to help.
Let's get out there!
Sources behind this piece:
- Canola Council of Canada plant population recommendations and Canola Counts (canolacalculator.ca);
- Saskatchewan Pulse Growers seeding rate and target plant density tables;
- Alberta Pulse Growers regional production material;
- Alberta Grains seeding rate tools and target plant stand publications;
- Ross McKenzie irrigated cereal research, Alberta Agriculture Lethbridge;
- Bob Nielsen, Purdue University, "Estimating Yield and Dollar Returns From Corn Replanting" (AY-264-W) and Corny News Network material on emergence and uneven stands; Carter et al. (1989) on uneven seedbed moisture and emergence;
- AHDB (UK Agriculture and Horticulture Development Board) quadrat protocol for cereal plant populations, nitrogen uptake, and dry matter assessment;
- AgPhD, "Corn Stand Counts: What They Mean and What They Tell You."
Free Download
Post-Rain Emergence Field Checklist
A free printable field worksheet to help assess stand counts, emergence uniformity, crusting, physical and brix assessment, pest pressure and replant decisions after heavy rain.
- Plant population
- Emergence uniformity
- Surface crusting
- Physical & BRIX assessment
- Missing plants & gaps
- Pest pressure
- Root & seedling health
- Nutrient Assessment


We respect your privacy. No spam. We will only send you what you asked for.

Crop Scouting Visit
Not Sure If Your Stand Is Worth Keeping?
Heavy rain, crusting, lag plants, and uneven emergence can make the field look worse — or better — than it really is. Download the field checklist first, then book a scouting visit if you want another set of eyes.
Book Your Crop Scouting Visit